Author Archives: jldunster

Version control with git

This blog is really just a place holder for my notes on using Git, which is probably the most widely used version control system. I swapped over from using CVS a while ago and, while I love Git, it can be a little tricky to get used to.

For my remote repositories I tend to use GitLab, because when I initially develop projects I like to keep them private, and GitLab offers free private accounts.

To start a new project you can either set up a repository on the website of your favourite remote repository (such as GitLab) and use ‘git clone’ to copy the repository to your local machine or you can create a repository locally (by moving to the directory where you store your files and using ‘git init’) and then push the repository (‘git push’) to copy it to the remote repository.

GitDrawing

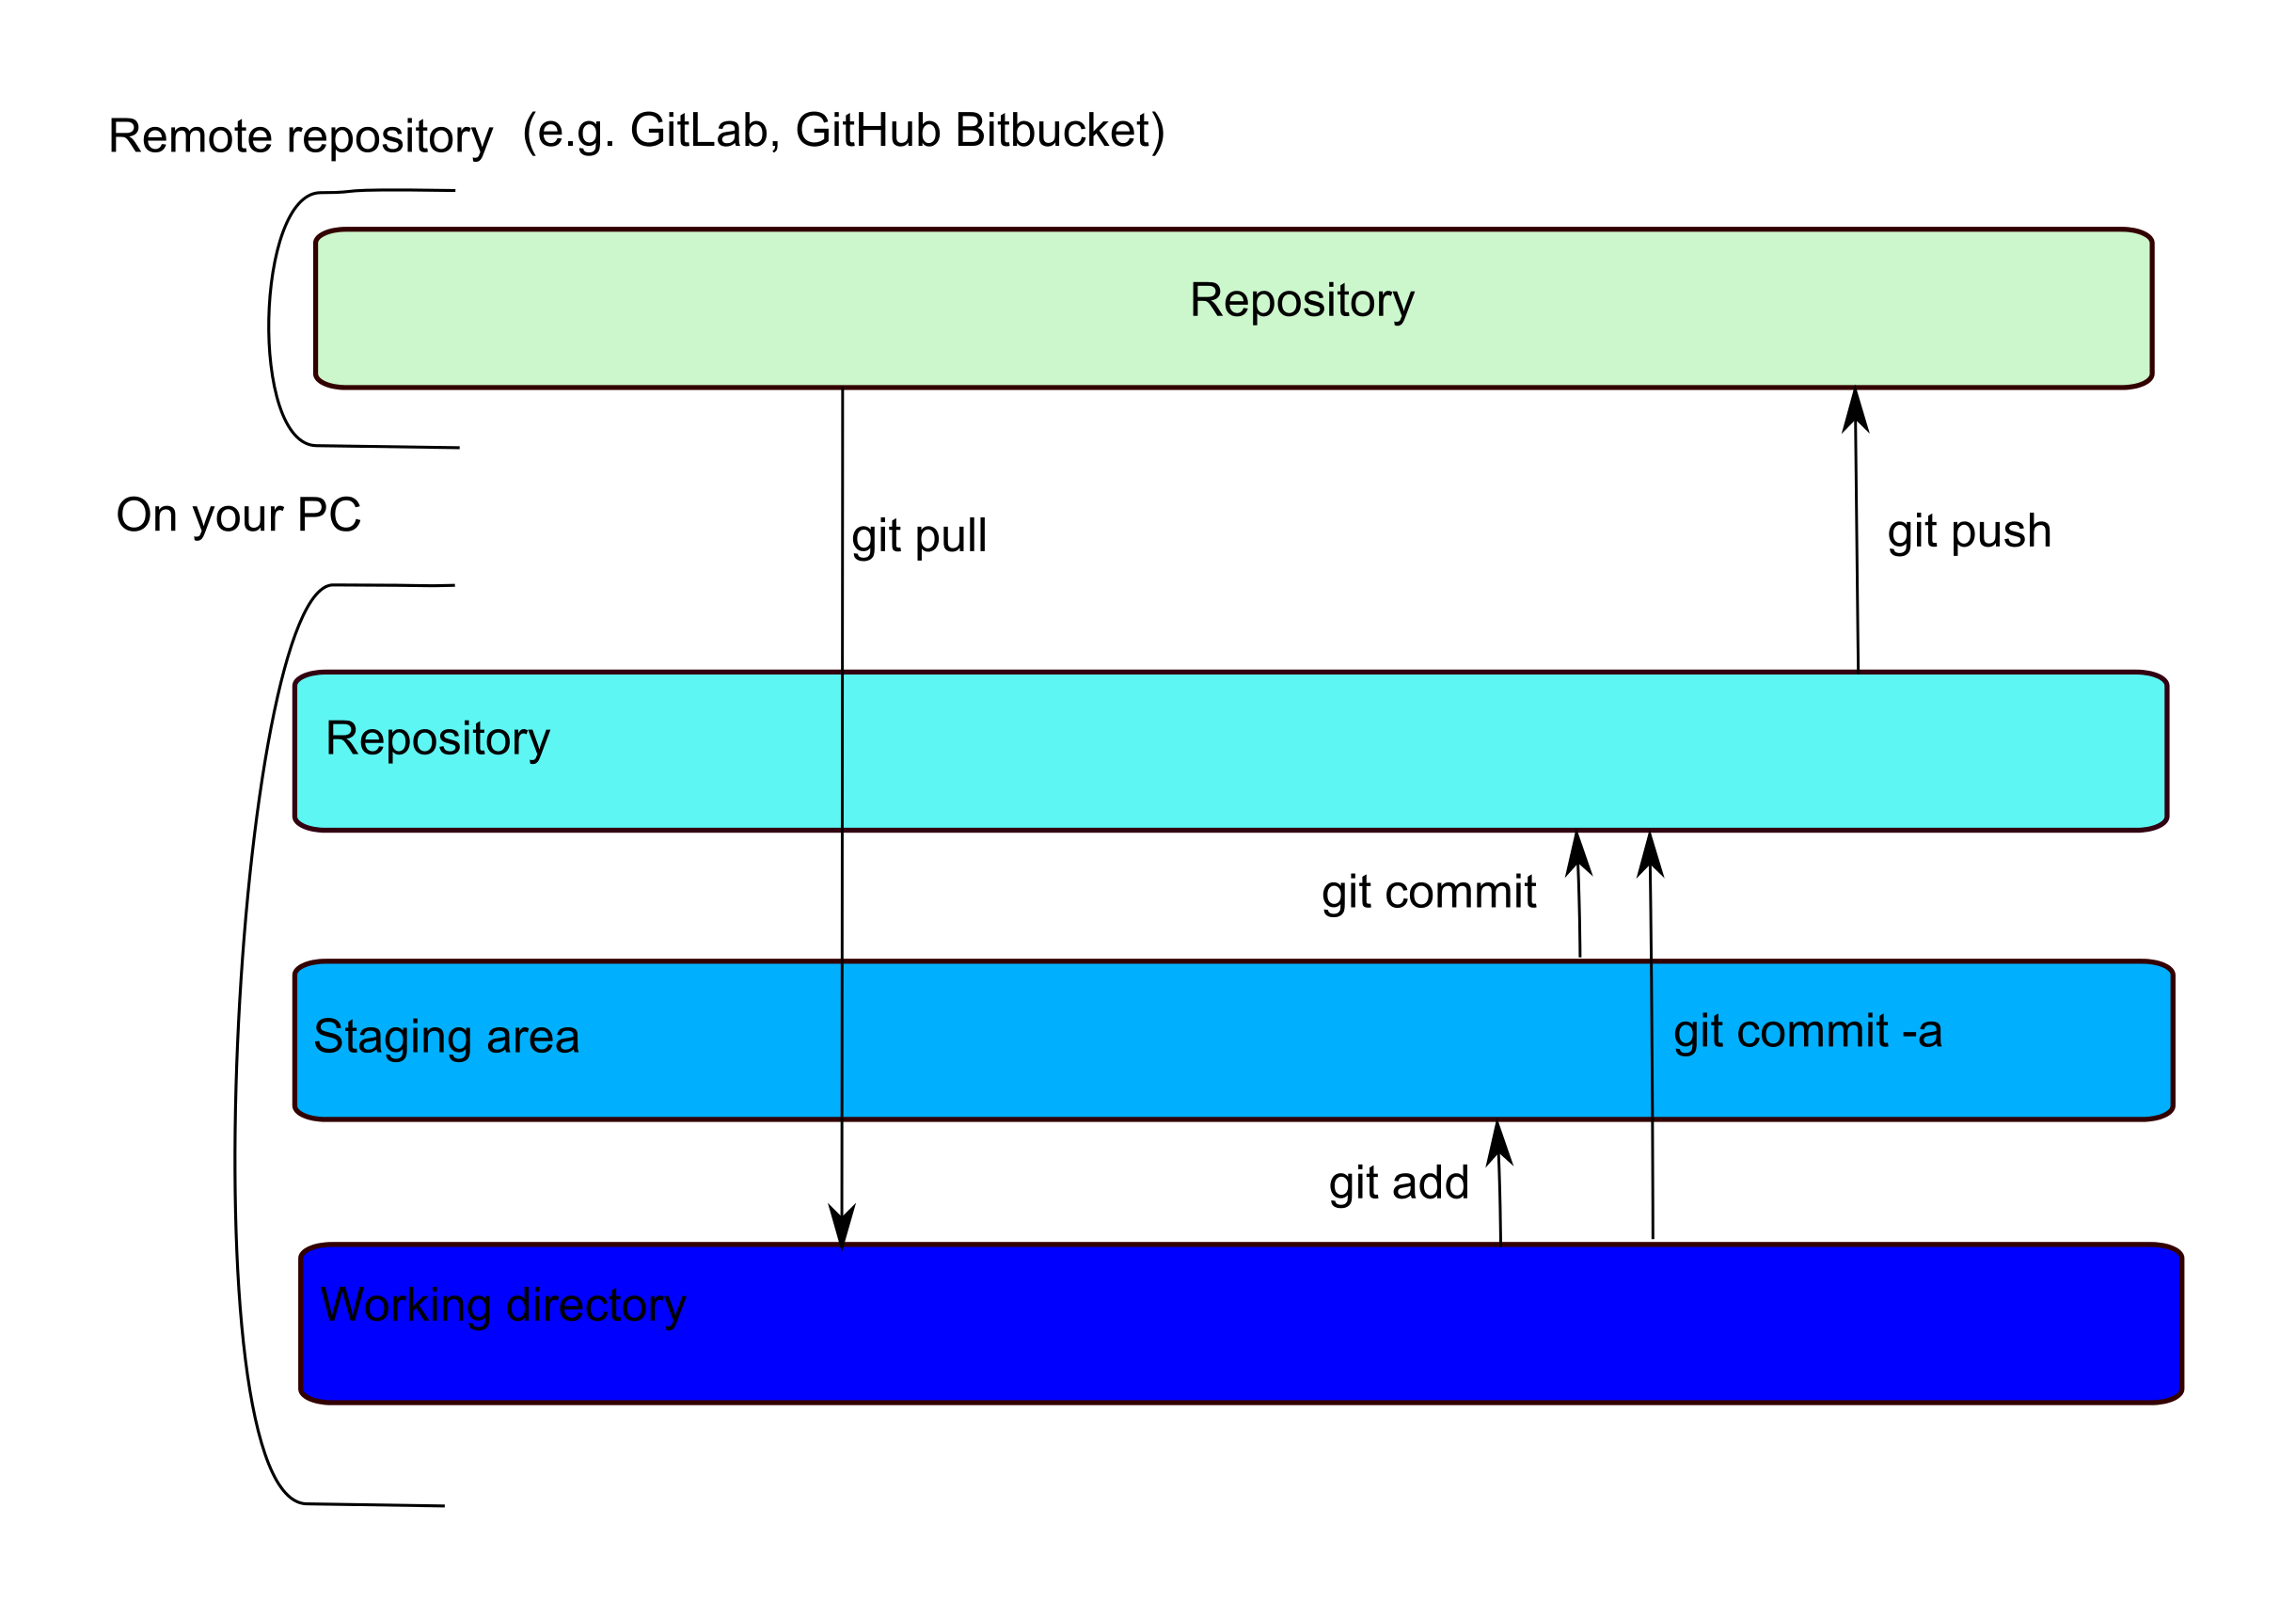
What can be a little confusing is that locally, while there is only one physical copy of your file, there are indexes that track if a file has been ‘added’ to a staging area or ‘committed’ to your local repository. This means that there is a two-step commit… you ‘git add’ to move a file to the staging area and ‘git commit’ to move it to the local repository. A ‘git push’ will move any committed files to your remote repository, where they can be accessed by collaborators.

Using the tapply function in R

There are lots of apply functions in R (apply, lapply, sapply etc) and they are used instead of loops. I find tapply particularly useful, it applies a function such as sum, mean or length to a subset of a table

There are three components,  tapply(1, 2, 3) where

  1. the vector of data you want to apply the function to
  2. the way to break the data up (this can be a single variable or a list of them
  3. the function (such as length or mean) that you wish to apply to the data

#load up some data
data(iris)

#example – obtain mean petal length per species
tapply(iris$Petal.Length, iris$Species, mean)

#Find the mean petal length for each species where the petal width is 1.4
tapply(iris$Petal.Length[iris$Petal.Width == 1.4], iris$Species[iris$Petal.Width == 1.4], mean, na.rm=TRUE)

#If you have problems with this check the two vectors are the same length
length(iris$Petal.Length[iris$Petal.Width == 1.4])
length(iris$Species[iris$Petal.Width == 1.4])

# example – I can find the average of two different subsets of the data by using a list
tapply(mtcars$mpg, list(mtcars$cyl, mtcars$am), mean)


#Other useful sources
https://www.r-bloggers.com/r-function-of-the-day-tapply-2/
https://stat.ethz.ch/R-manual/R-devel/library/base/html/tapply.html

python and the Anaconda repository

I tend to use the Anaconda Python distribution, it makes life a little easier by including all the data science packages I like to use (NumPy, SciPy, matplotlib, pandas, Jupyter Notebook and scikit-learn). While I predominantly use Linux Anaconda apparently makes life a lot easier in a Windows or Mac environment.

The package manage for Anaconda is conda (command line) and there is now a GUI interface available (called anaconda-navigator). To run the navigator type anaconda-navigator at the command line.

to check if conda is installed (or which version):

conda –version

conda info

to update Anaconda to the latest version:

conda update conda

The installation of Anaconda adds a new path to the beginning of the environment variable PATH ensuring that anaconda bin will be utilised before the standard python bin.


Some useful coding style guides

While I’m sure I don’t always follow this advice, using a coding style guide makes sense and was something I always stressed was essential when working in teams. Even when you are working on your own using a coding style guide generates code that is much easier to maintain.

It turns out that Google publishes their own style guide, I quite like them and so I’ve published the links to them below (just the ones I’m most likely to use). All I was really missing was a style guide for Matlab and Julia so I’ve added a link to Matlab and Julia.org’s own.

Google encourages the use of TODO comments in code, a nice and consistent way of marking areas of code that need improving (TODO(user)).

R style guide

Shell style guide

Python style guide

Matlab style guide

Julia style guide

A great way of getting the high quality data needed for modelling subcellular events.

While biological studies are rapidly generating a clear picture of the key components involved in intracellular pathways they often lack  details of how these components interact.  Understanding these interactions is essential if we want to understand how a cell reacts to its environment. Mathematical modelling is a great to fill in these details but the problem is that high quality mathematical models need to be inferred from high quality data!

Traditionally experimental data that describes subcellular signalling events such as protein phosphorylation comprises few time points and are not quantified. Our recent paper (DOI: 10.1371/journal.pcbi.1004589) details a way of quickly obtaining the necessary high-density quantified data making it easier to infer mathematical models.

Investigations into Jupyter

I’ve been investigating Jupyter Notebook (previously called ipython). It’s an interactive environment in which you can embed code, add text, equations and plots. It would be a great tool to use for teaching (and that is the context in which I cam to hear of it). Students can play with examples, modify them, write their own adding text and equations where they want.

While designed for interactive python apparently you can also load other languages including R, Julia and Octave (though I’ve yet to successfully do this) and notebooks can be exported to Latex, pdf or html.

Further reading:

Tony Hirst

Trying out Jupyter Notebooks